Manual
The aim of this toolbox is to facilitate the voxel-based and volume-based analysis, and the automatized construction of new tracer-specific templates for small animal positron emission tomography (PET) and single-photon emission computed tomography (SPECT) brain images.
The toolbox is intended to work in combination with the Statistical Parametric Mapping (SPM) software, and most of the SAMIT functions require the presence of this software in the MATLAB environment.
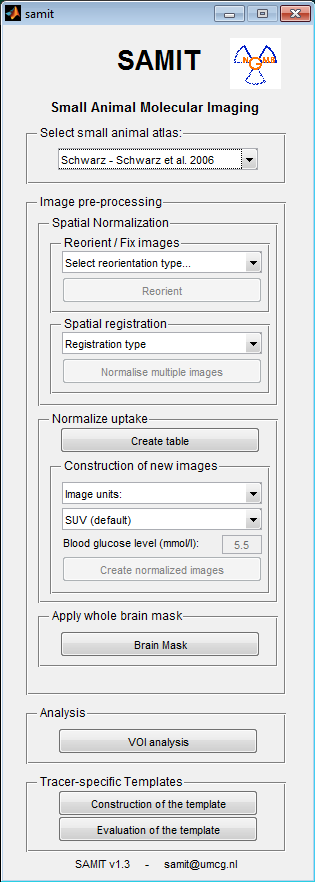
Select Atlas
The very first step is to select the desired animal atlas. This step is needed to populate some predefined values and to allow the interaction with the rest of the options.
The last option on the drop-down menu is Create a new atlas…. The details about this function to include new atlases and templates is explained later in this manual (see How to Include a New Atlas).
Image pre-processing
Spatial normalization
- Reorient. This option allows to reorienting images that were previously registered in other software packages, e.g. PMOD or VINCI. Includes basic operations such as to relocate the coordinates system or to reorient the image as expected by SPM (read Appendix. Image Orientation for further details).
- PMOD2SPM: This option allows to reorient the images created in PMOD to the orientation expected in SPM.
- SPM2PMOD: In this case, the images in SPM space are reoriented into PMOD space.
- VINCI: The NIfTI files created in VINCI present an error in the stored transformation matrix, which can cause problems with the voxel size and the orientation in SPM. This simple fix solves the issue.
- Bregma: The proper location of the coordinates system in the image is crucial when handling the images. The zero or “origin” of the coordinates system is frequently located in bregma in small animals, but not all the animal template follow this recommendation.
- Center: If bregma is not properly defined with the atlas information, the center of the image is a good alternative as a reference in the coordinates system.
- Spatial registration. This section of the toolbox use the normalization process implemented in SPM8, and allows the selection of multiple images at once.
- Registration type (for further details see ‘spm_affreg’ from SPM)
- Normalize multiple images
Notes: The registration step is not necessary if the images were previously aligned to the template in another software package (e.g. PMOD or VINCI). If that is the case, only the reorientation is needed.
The best results are obtained when the images and the reference template have similar dimensions and a good initial overlap.
Normalize uptake
This section allows the normalization of the uptake values in multiple images. The procedure has two steps:
- Create table. The input file can be created manually or with the help of
Create table button. It will ask for the images that will be normalized, and it will generate a table. The content of this table can be filled with any text or spreadsheet editor. When completed, the table can be saved as a tabulated file (*.txt) or Excel file (*.xls / *.xlsx).
- First column: Full path and name of the image
- Second column: Activity of the injected tracer (MBq)
- Third column: Animal body weight (gr)
- Fourth column: glucose level in blood (mmol/l)
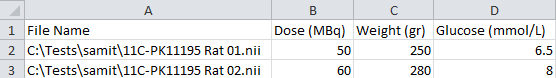
Note: If the glucose was not measured, or it is not going to be used for the normalization, the whole column can be removed.
- Construction of new images
- Image units: Select the radioactivity units used when the image was created.(Note: By default, PMOD software stores the images as kBq/cc)
- Normalization type.
- SUV (Standardized Uptake Values). The new image will have the suffix –SUV
- SUVglc (SUV corrected for blood glucose). The new image will have the suffix –SUVglc
- SUV whole brain. The SUV will be corrected for the mean uptake value of the whole brain. The new image will have the suffix –SUVw
- IDg (Percentage of injected dose per gram). The new image will have the suffix –IDg
- Basal Glucose Plasma. The reference value for the glucose level (only available when SUVglc is selected).
- Create normalized images. The new images will be created according to the parameters selected and the information probided in the file (table).
Apply whole brain mask
A new image will be created by removing the signal from outside of the brain. The brain mask will be selected automatically according to the default parameters of the atlas (samit_atlases.txt). The new constructed images will have the prefix m.
Analysis
The purpose of this section is to facilitate the extraction of the descriptive values from the images, which can be further used for statistics analysis. The program will ask you for the image containing the Volumes of Interest (VOIs), and then will ask for the image(s) from where the values want to be calculated. The results will be saved in a tabulated text file (*.txt) and in a Matlab file (*.mat).
Important: The extraction of the results will proceed even if the files had different orientation or dimensions than the VOIs. Its recommend to use only images already aligned and with the same dimensions than the desired SAMIT template. The results obtained with images with different orientations and/or dimensions might not be correct!!
Templates
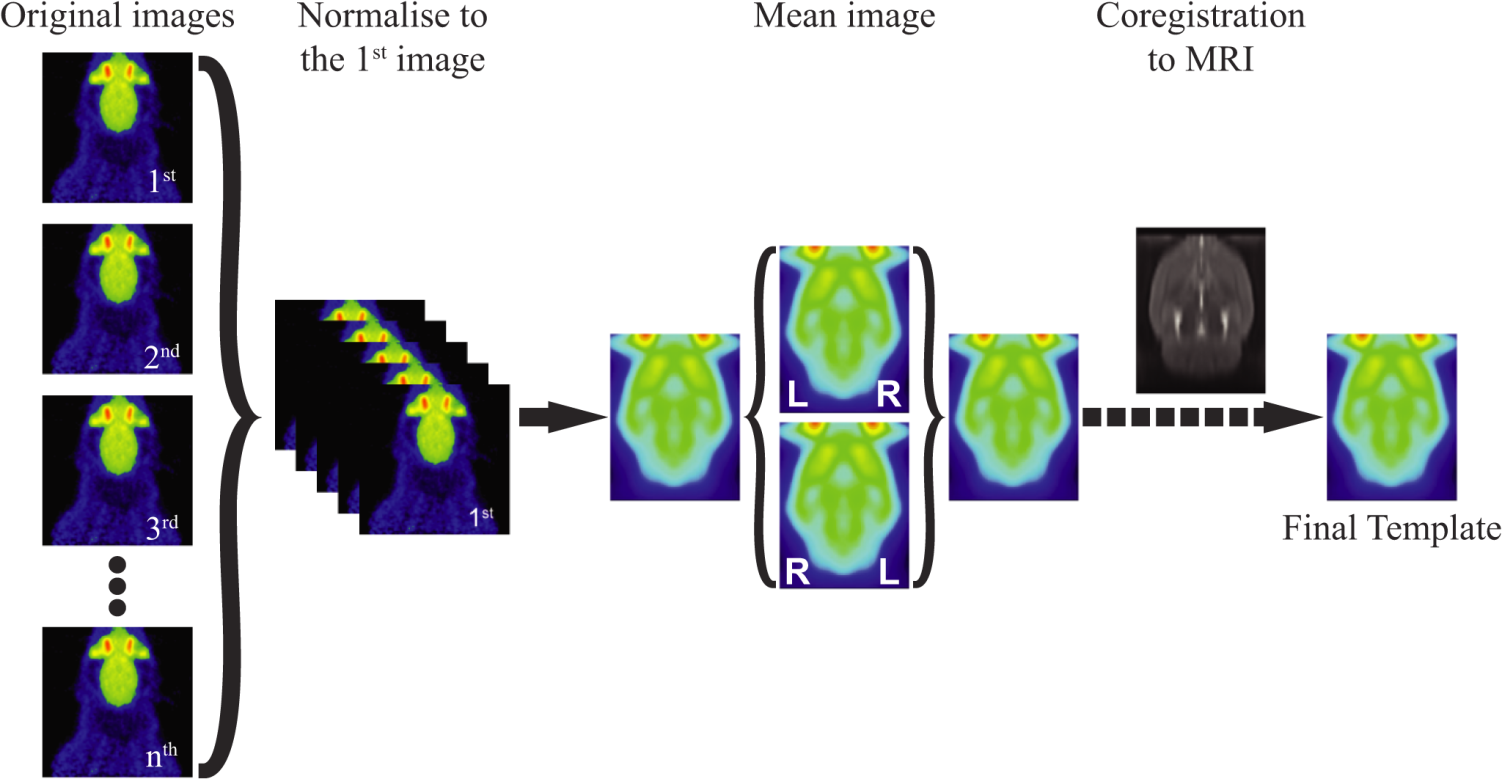
The construction process to obtain tracer-specific PET and SPECT templates have been automatized as described in Vallez Garcia et al. 2015. The program assumes that the images are already aligned between them in space and uptake (e.g. in PMOD software and then reoriented to SPM). The first image selected in the list will be used as the reference image, and all the other images will be aligned to this one in the first step of the template construction.
Note: It is recommended to check the images that will be used for the construction of the template with Check Image Registration (Check Reg) in SPM, to select the most appropriate reference image and to confirm that the images are correctly aligned between them.
It is also recommended to use images with a bigger dimension than the one of the reference MRI. This will allow later the construction of templates with different sizes, and it will avoid regions with zeros or NaN in the image.
The steps performed by the program are:
- Spatial normalization of the selected images to the first one.
- Construction of a mean symetrical image.
- Co-registration of the symmetrical image to the reference MRI template.
- Co-registration of the images used for the construction of the template with the parameters obtained in the previous step. This new images are saved with a prefix r and they can be used for the evaluation of the template.
- The final version of the template and its registration with the MRI is displayed.
Several files will be created when the construction of the template is completed:
- NameTemplate_coreg.mat The co-registration matrix obtained in the step 3
- NameTemplate_MRI_Size.nii The new template with the same dimensions and voxel size as the reference MRI
- NameTemplate_Original_Size.nii A version of the template but that preserves the original dimensions of the images. The co-registration matrix is stored in the file, but the image is not resliced. This image can be used for the construction of other versions of the template with different dimension size.
The evaluation of the registration accuracy of the images to the template can be performed by selecting Evaluation of the template. The previously constructed template must be selected (*_MRI_Size.nii) followed by the new version of the images used for the construction of the template.
How to Include a New Atlas
Starting with version 1.3, the toolbox includes a new functionality to facilitate the addition of new small animal atlases to SAMIT. This option can be accessed by selecting Create a new atlas…, the last option of the drop-down menu Select small animal atlas.
When this option is selected, a new interface will be displayed. The usage is quite intuitive, and it requires to follow the options from the top to the bottom of the interface.
The only required files to create a new atlas set are 1) the MR image and 2) a binary brain mask. This images must comply with SPM orientation requirements (see [Appendix. Image Orientation]).
- Load Image. First of all, select the brain image that will be used to draw the contour of the brain. This image will be used in the display of the results of SPM, the so-called ‘glass brain’ or ‘maximum intensity projection’ (MIP) image.
Note: While some options are provided to adjust the drawing, for optimal results we recommend to use the image presenting a binary mask of the brain or the MR.
- Create MIP. Adjust the display of the contour.
- Margin. This option can be used to adjust the zoom of the image, by adjusting the margins between the subpanels.
- Threshold. When the MR is used, for example, this option allows defining the contour of the image based on the intensity of the image
- Canny Upper & Canny Lower. If the ‘Auto edge limits’ option is not active, this two parameters can be used for fine adjustments of the contour.
- Save MIP & Atlas. Here you can define the details about the new atlas.
- Animal Species. For example, rat or mice (no spaces allowed).
- Atlas Name. For example, Schwarz (no spaces allowed)
- Atlas Details. Short description about the atlas (spaces allowed).
- Atlas MR Image. MR image that will be used as the reference for co-registration when a new PET/SPECT template is constructed.
- Atlas Brain Mask. Binary image that will be used for brain masking.
- Create New Atlas. When all you are satisfied with the MIP and the details of the atlas, this button will create the needed files, and the new atlas will be included in your SAMIT installation.
- samit_atlas.txt This file is read by SAMIT to populate the menu with the available atlases. When a new atlas is created, a new entry will be automatically generated. If you want to avoid that a specific atlas is loaded by SAMIT, comment the line using //.
- MIP.mat Maximum intensity image used for visualization of the results in SPM
- ‘mask’ folder It will contain a copy of the ‘Atlas Brain Mask’ selected earlier. This folder can be used to store different masks, according to the needs of each research group.
- ‘templates’ folder Its purpose is to contain the ‘Atlas MR image’ as selected earlier and all the future PET/SPECT tracer-specific templates related with this MR atlas.
- VOIs’ folder Its purpose is to contain different sets of VOIs, which can be used in combination with the ‘VOI analysis’ function of SAMIT.
References
Atlases
- Ma et al., 2005. A three-dimensional digital atlas database of the adult C57BL/6J mouse brain by magnetic resonance microscopy. Neuroscience, 135(4) (doi: 10.1016/j.neuroscience.2005.07.014)
- Ma, Y. et al., 2008. In Vivo 3D Digital Atlas Database of the Adult C57BL/6J Mouse Brain by Magnetic Resonance Microscopy. Frontiers in neuroanatomy, 2(April) (doi: 10.3389/neuro.05.001.2008)
- Schwarz et al., 2006 A stereotaxic MRI template set for the rat brain with tissue class distribution maps and co-registered anatomical atlas: application to pharmacological MRI. NeuroImage 32(2) (doi: 10.1016/j.neuroimage.2006.04.214)
- Saikali S, Meurice P, Sauleau P, Eliat PA, Bellaud P, Randuineau G, Vérin M, Malbert CH. A three-dimensional digital segmented and deformable brain atlas of the domestic pig. J Neurosci Methods. 2010; 192(1):102-9. doi: 10.1016/j.jneumeth.2010.07.041
SAMIT and tracer-specific templates
- Vállez Garcia et al., 2015. A Standardized Method for the Construction of Tracer Specific PET and SPECT Rat Brain Templates: Validation and Implementation of a Toolbox. PLoS One, 10(3) (doi: 10.1371/journal.pone.0122363)
- Casteels et al., 2013. Construction and evaluation of quantitative small-animal PET probabilistic atlases for [18F]FDG and [18F]FECT functional mapping of the mouse brain. PLoS One, 8(6) (doi: 10.1371/journal.pone.0065286)
- Casteels et al., 2006. Construction and evaluation of multitracer small-animal PET probabilistic atlases for voxel-based functional mapping of the rat brain. J Nucl Med, 47(11) (link)
 The aim of this toolbox is to facilitate voxel-based and/or volume-based analysis of small animal PET and SPECT brain images. It also provides an automatized procedure for the construction of new tracer-specific templates for the spatial registration of small animal PET and SPECT brain images.